Skip to content
FLEET SHIELD
Demo

Fleet Financial Command Center

You know what your fleet grosses. Do you know what every truck actually keeps?

Fleet Shield is financial intelligence and decision support for trucking fleets — unit-level profitability, true operating costs, load economics, settlements visibility, cash timing, and management reporting.

Automated fractional CFO disciplines run continuously across your units — so you are not waiting on monthly close or a consultant’s calendar to see margin leak.

Application screenshots use the live demo environment with sample fleet data. Illustrative only — not verified customer outcomes.

Sample data · demo.fleetshield.xyz
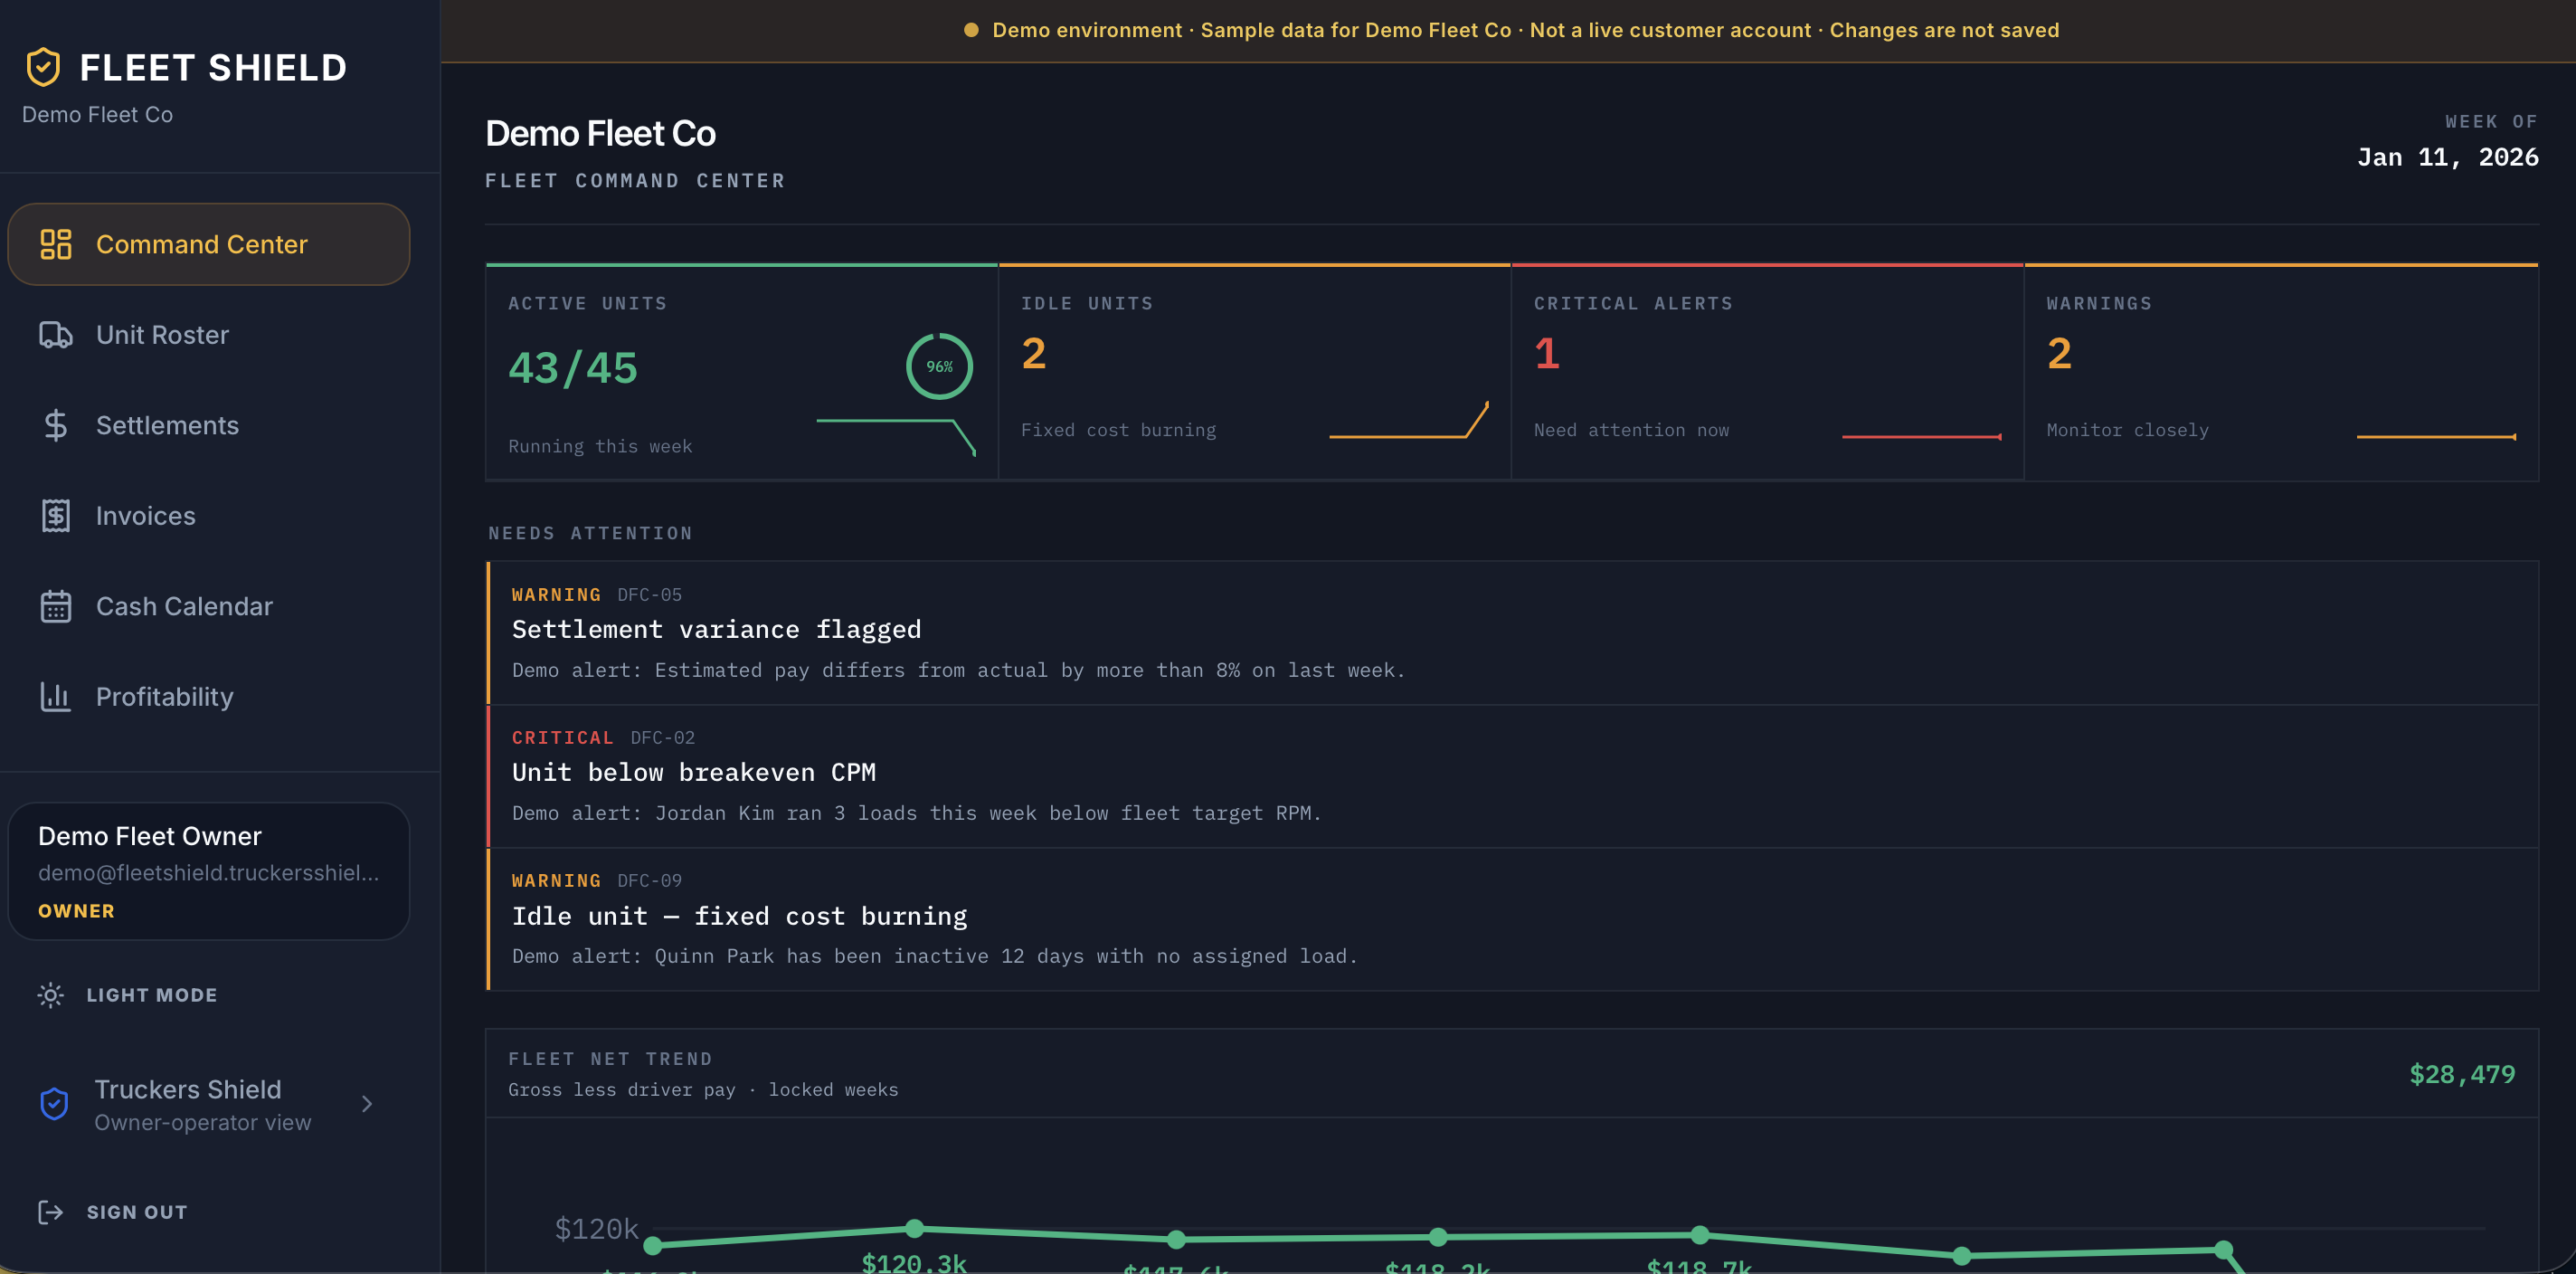
Live demo · sample data Fleet Shield Command Center showing fleet KPIs, operational alerts, and net trend in the demo environment.

Sample fleet margin snapshot

Illustrative demo data

When consolidated averages hide spread, individual units can run above or below break-even without a fleet-wide alarm. Fleet Shield is built to surface that spread — this panel is a stylized example, not customer results.

3 above target
1 watch
2 below break-even
  • Unit 104
    +12%
  • Unit 118
    +6%
  • Unit 122
    +3%
  • Unit 087
    −2%
  • Unit 031
    −9%
  • Unit 056
    −14%

Sample alert: 2 units below break-even · review in Compare & Profitability

Financial intelligence — not dispatch or general ledger software

Your TMS moves freight. Your bookkeeper and CPA close the books. Neither is built to answer, in real time: which units are profitable this week, whether a rate covers true cost, or where cash will gap before payroll.

Your TMS manages freight. Fleet Shield helps you understand the financial performance of your operation.

TMS & accounting focus

  • Dispatch, load workflow, and document capture
  • Transaction coding and tax filing
  • Fleet averages and lagging monthly reports

Fleet Shield focus

  • Per-unit operating cost and profitability
  • Pre-dispatch rate floors and load economics
  • Settlements-aware margin, cash calendar, weekly fleet financials

Fleet Shield does not replace your TMS, ELD provider, or accounting system. It adds a financial command layer on top.

Know what every unit makes — and what it costs to run

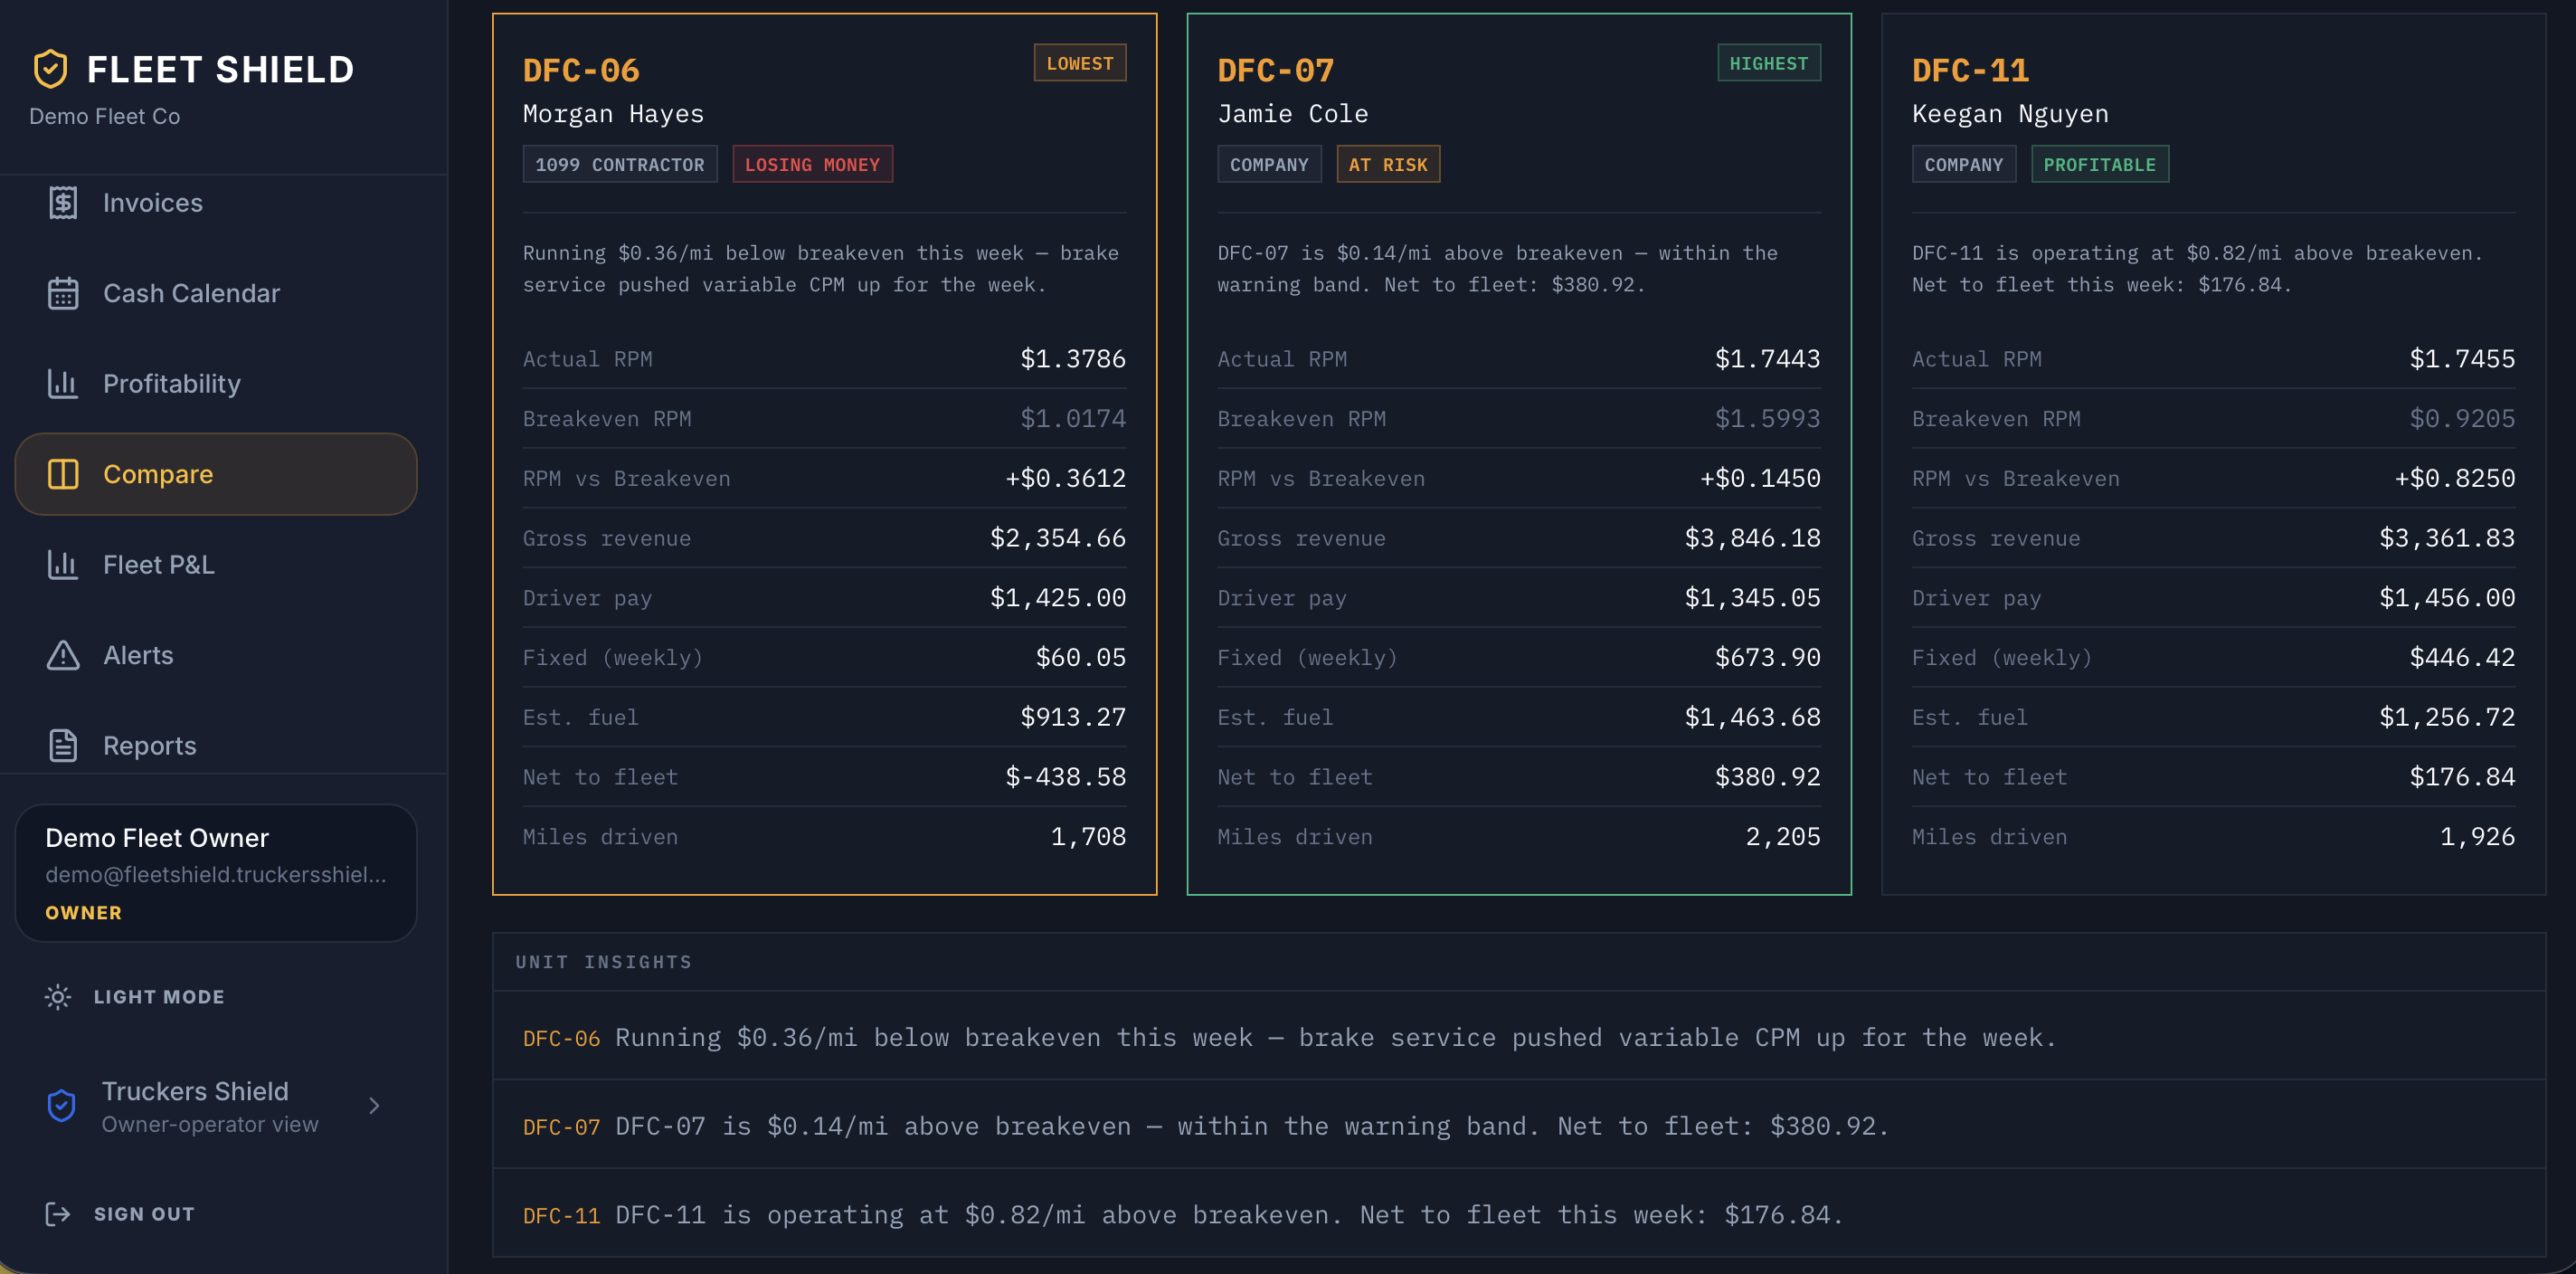
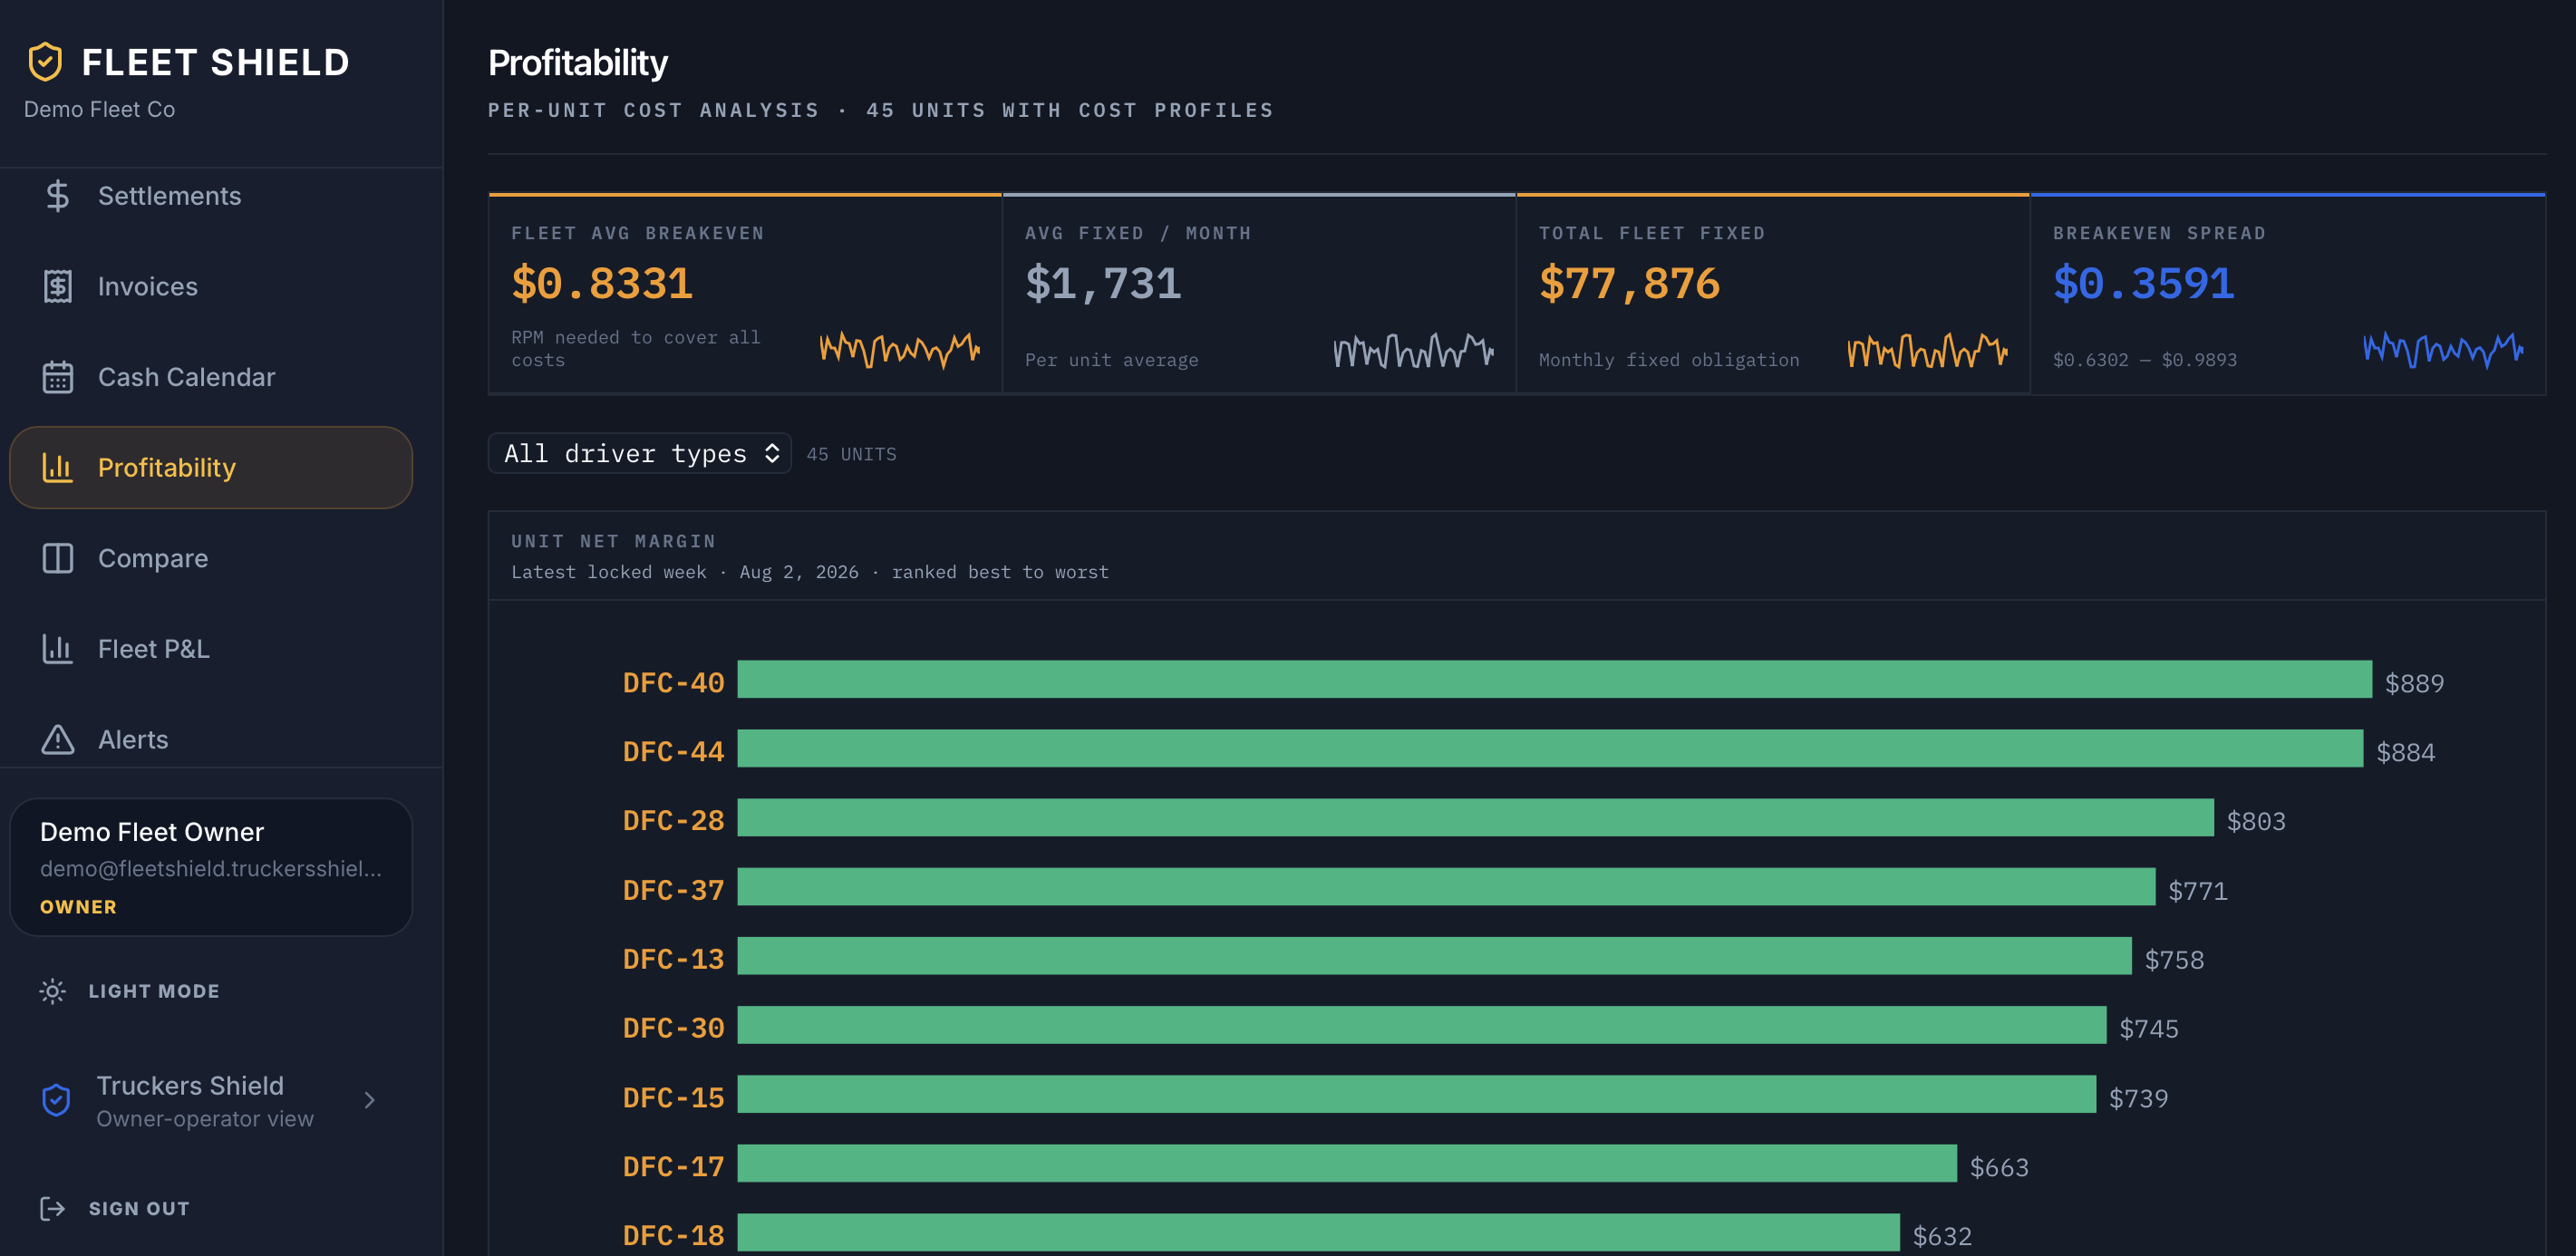
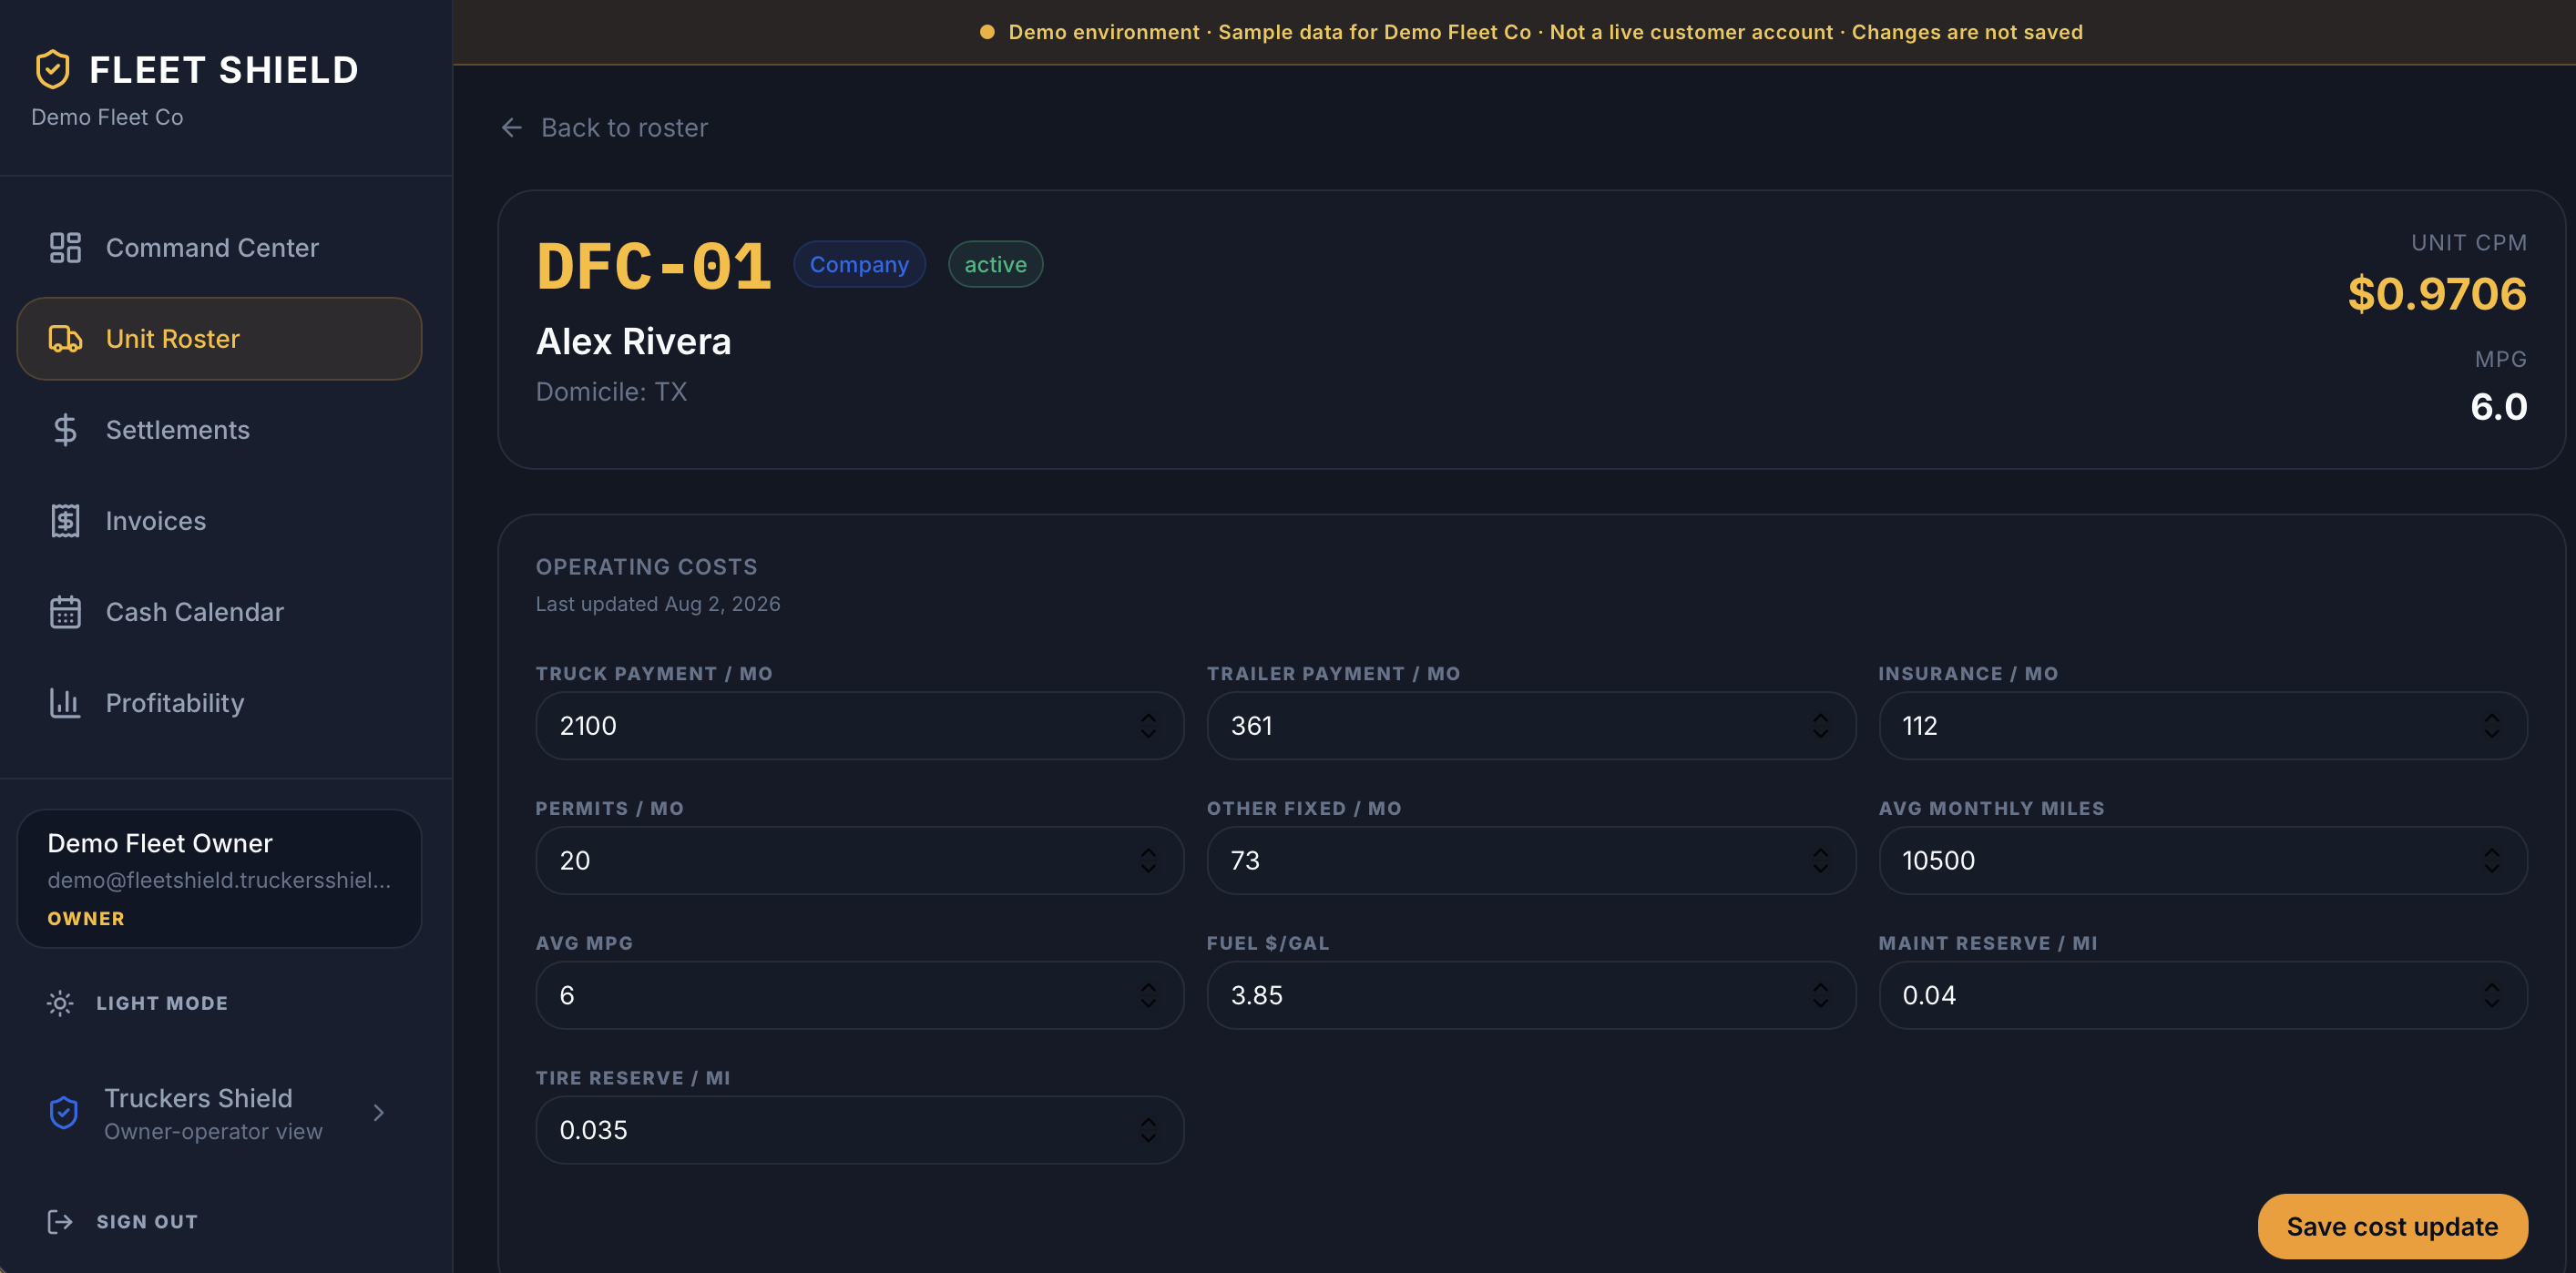
Compare trucks side by side, rank net margin, and drill into operating cost structure by unit. That is how you find underperformers before they hide inside a healthy fleet average.

Three-unit financial comparison in Fleet Shield.
Unit profitability with net margin bar chart.
Single-unit operating costs and cost per mile detail in Fleet Shield.

Swipe horizontally on mobile to read dense tables · sample demo fleet

Rate Advisor — decide before the load goes out

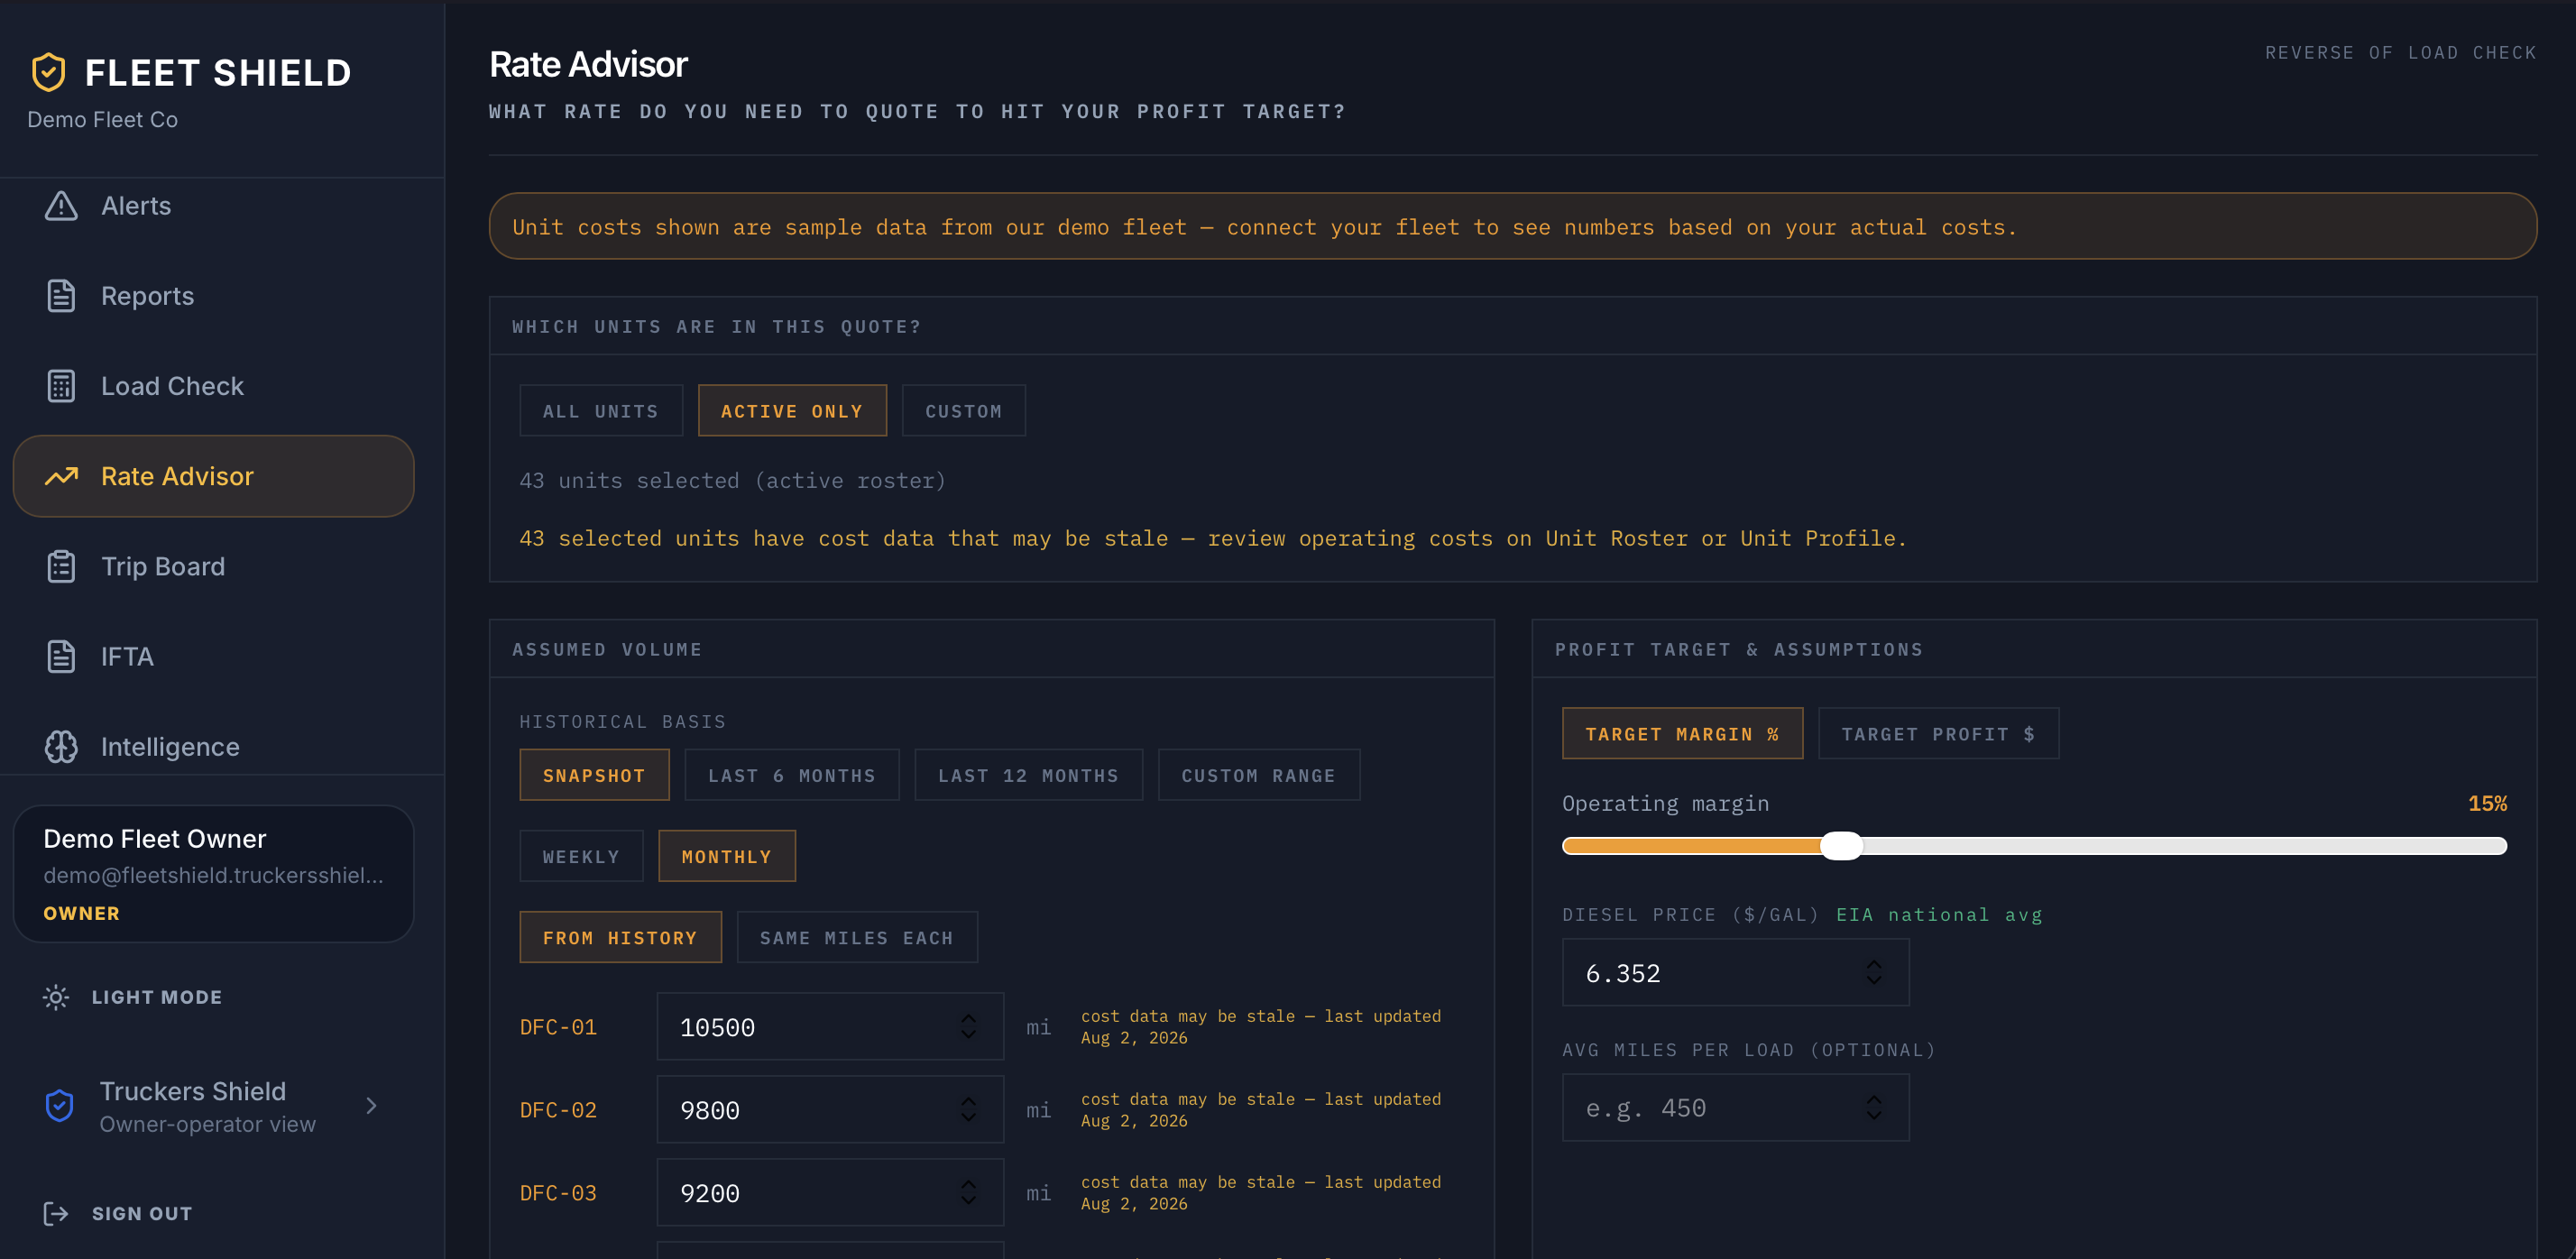
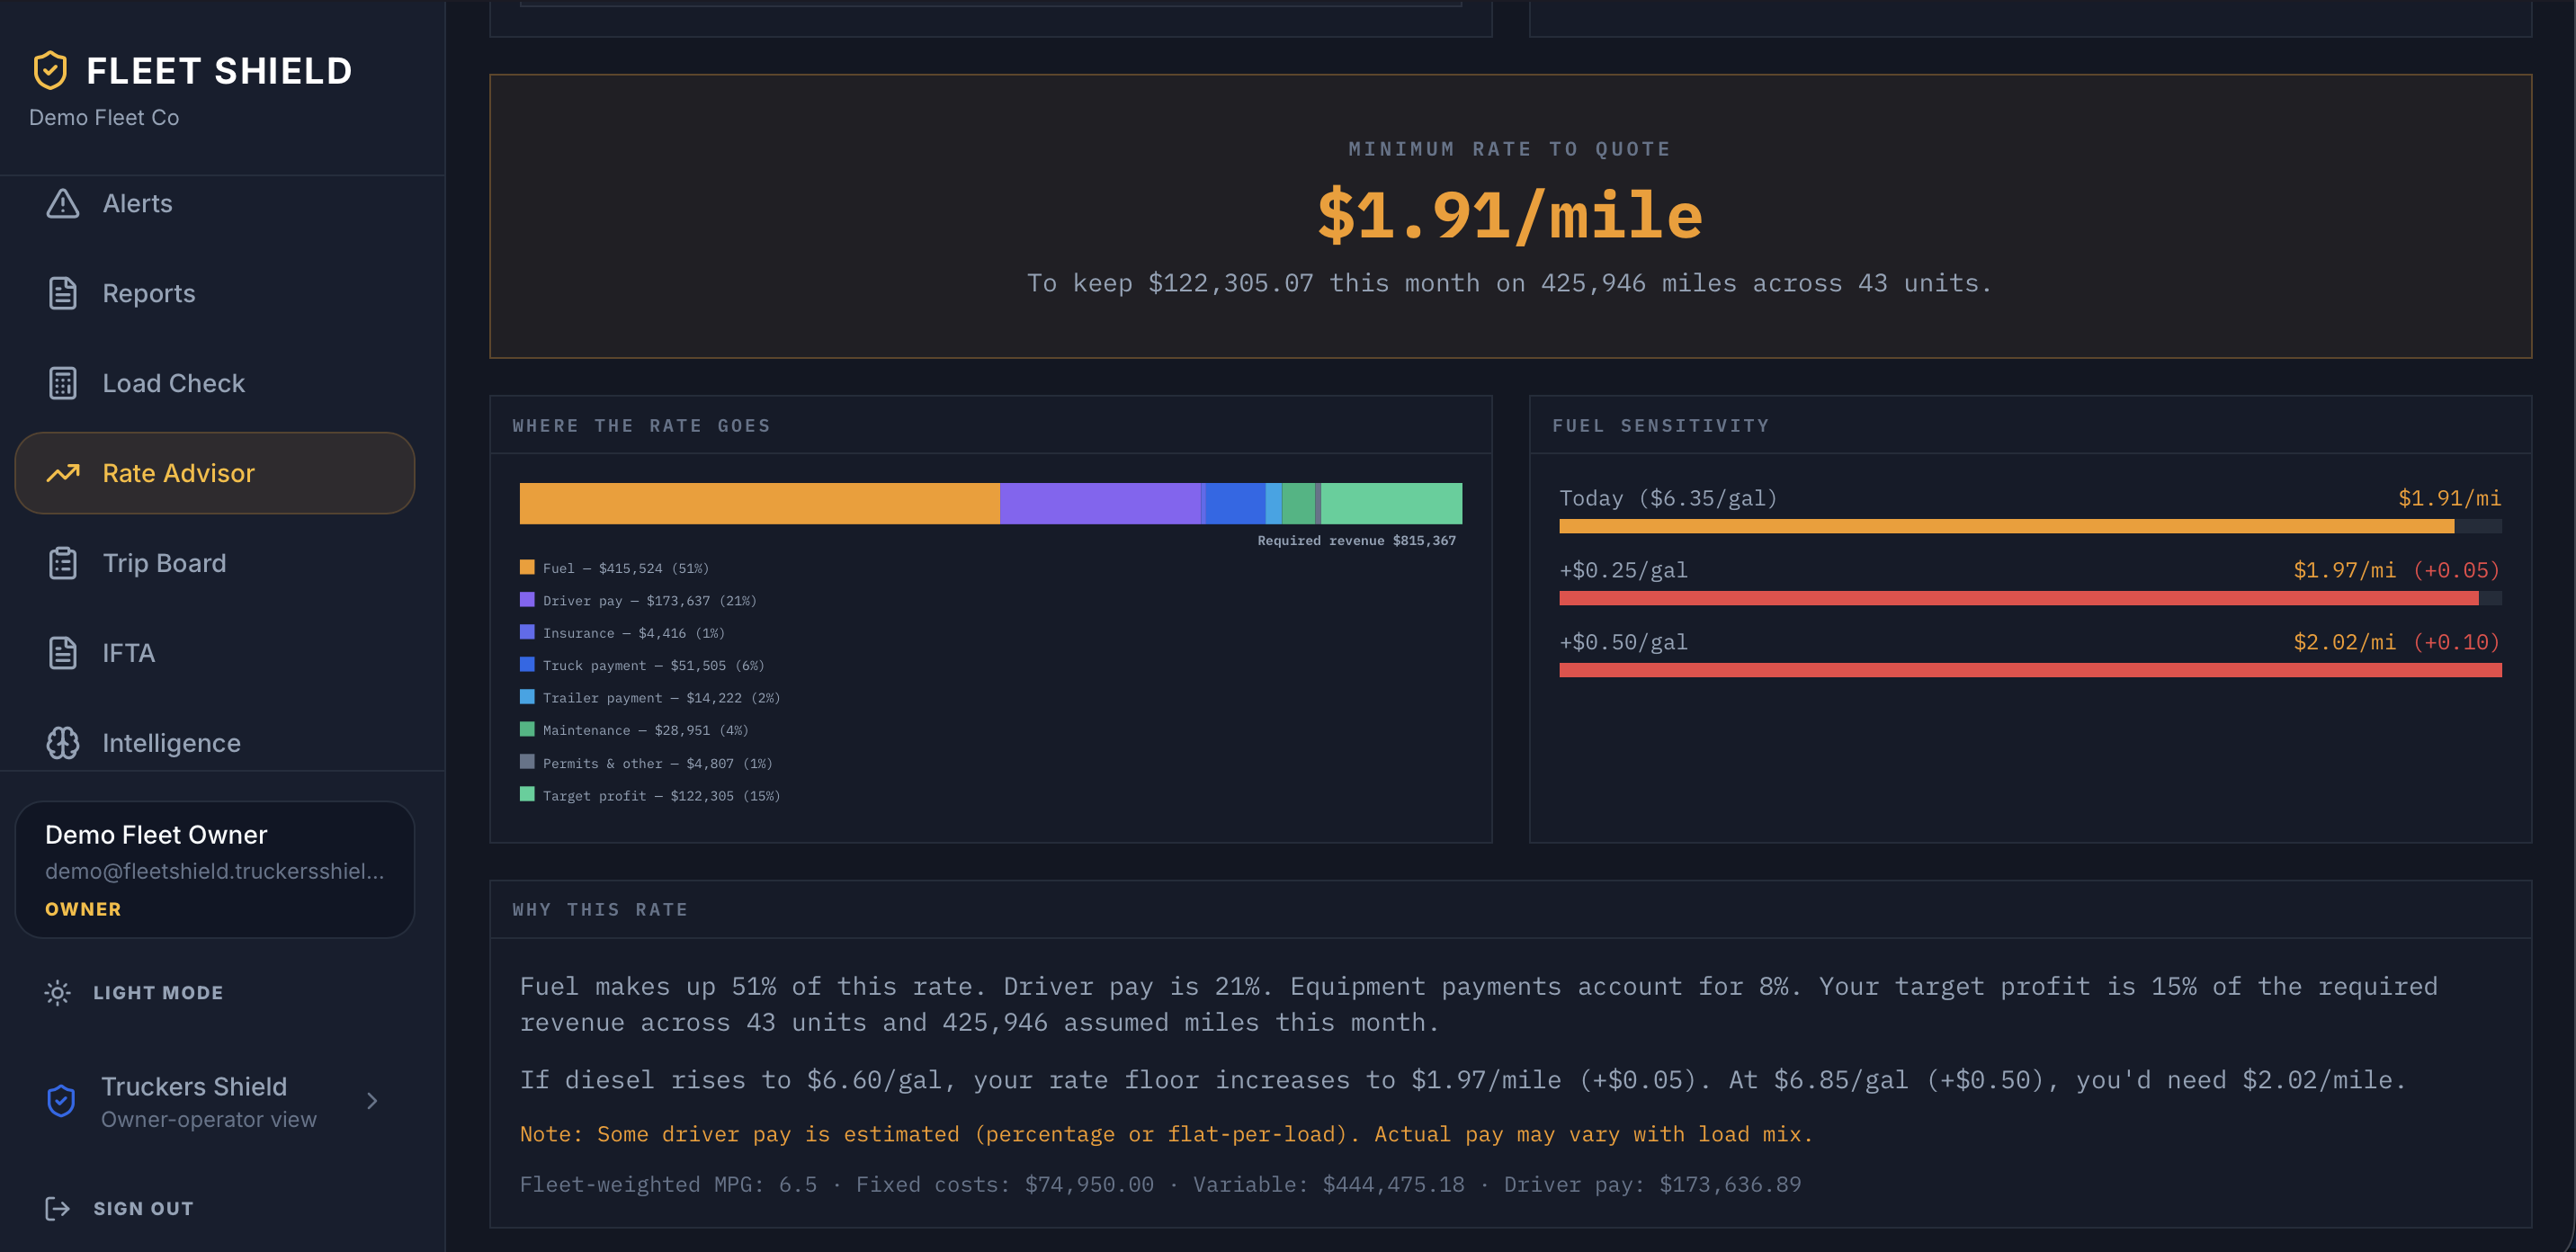
Model a quote against each unit’s cost structure and profit target. See a recommended floor rate and breakdown so dispatch and leadership align on TAKE IT or PASS IT before the rate con is signed.

Fleet Shield Rate Advisor configuration for a sample freight quote.
Rate Advisor results with recommended rate per mile and cost breakdown.

Demo quote · illustrative rates, not market guarantees

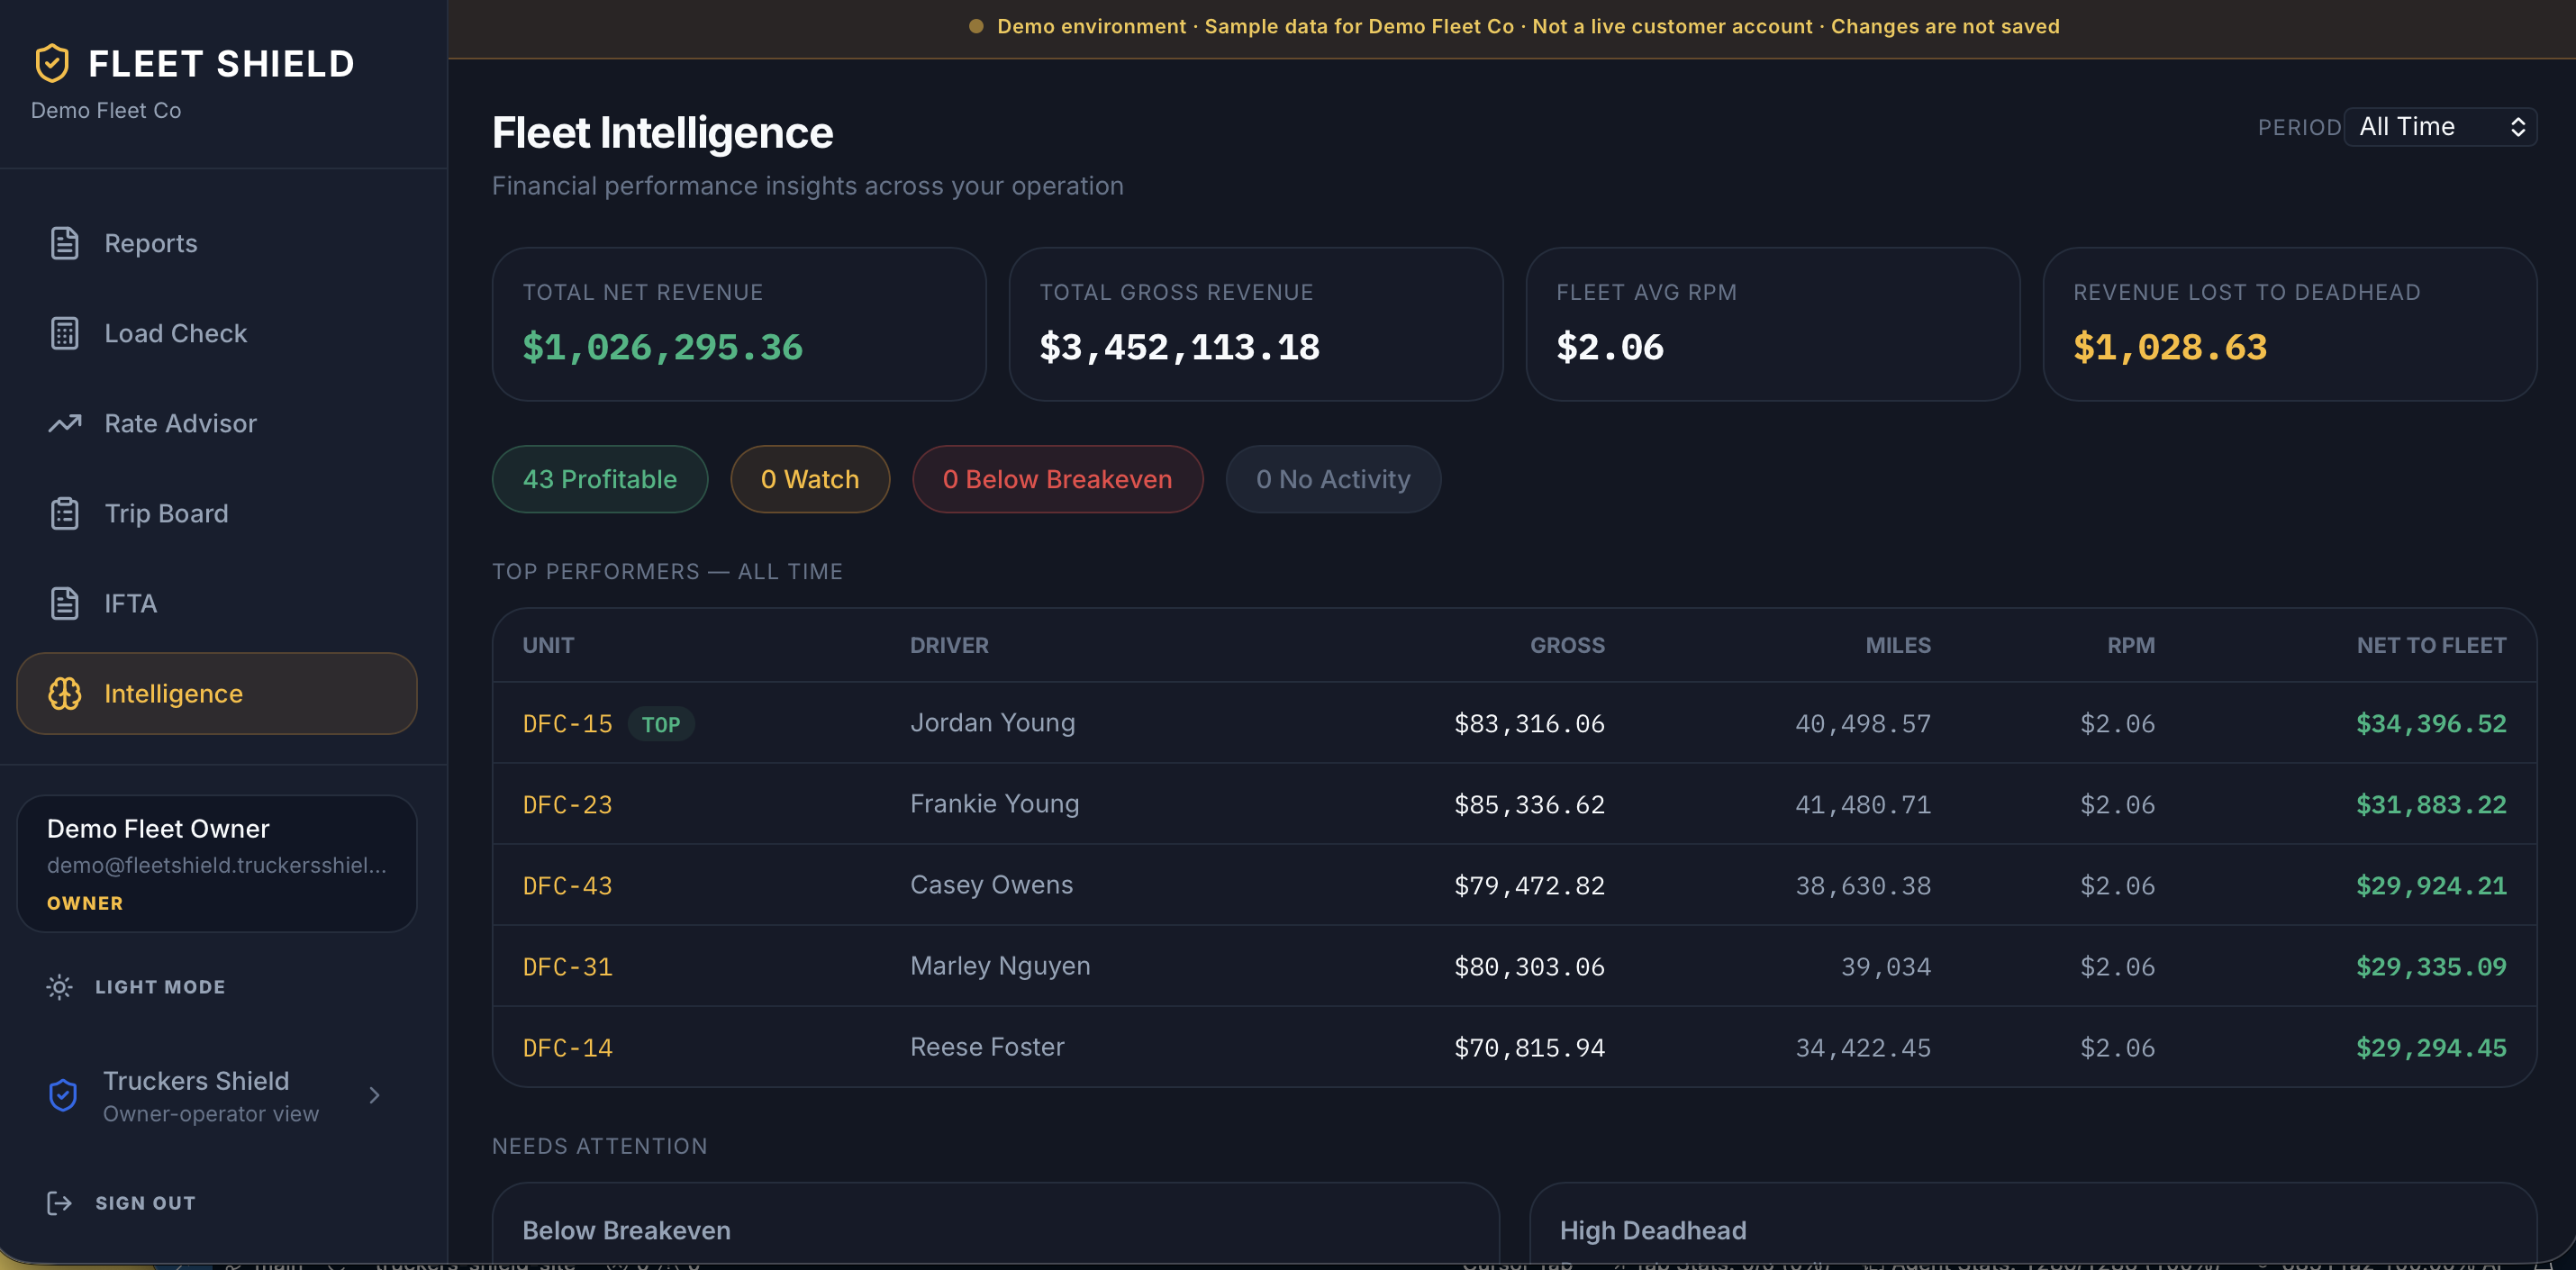
Command center, intelligence, and operational alerts

Monitor active units, financial roll-ups, and exception signals in one place — the view owners and ops leaders use when revenue looks fine but margin or cash does not.

Intelligence dashboard with top performers and fleet status.

Cash Calendar — obligations, receipts, and gaps

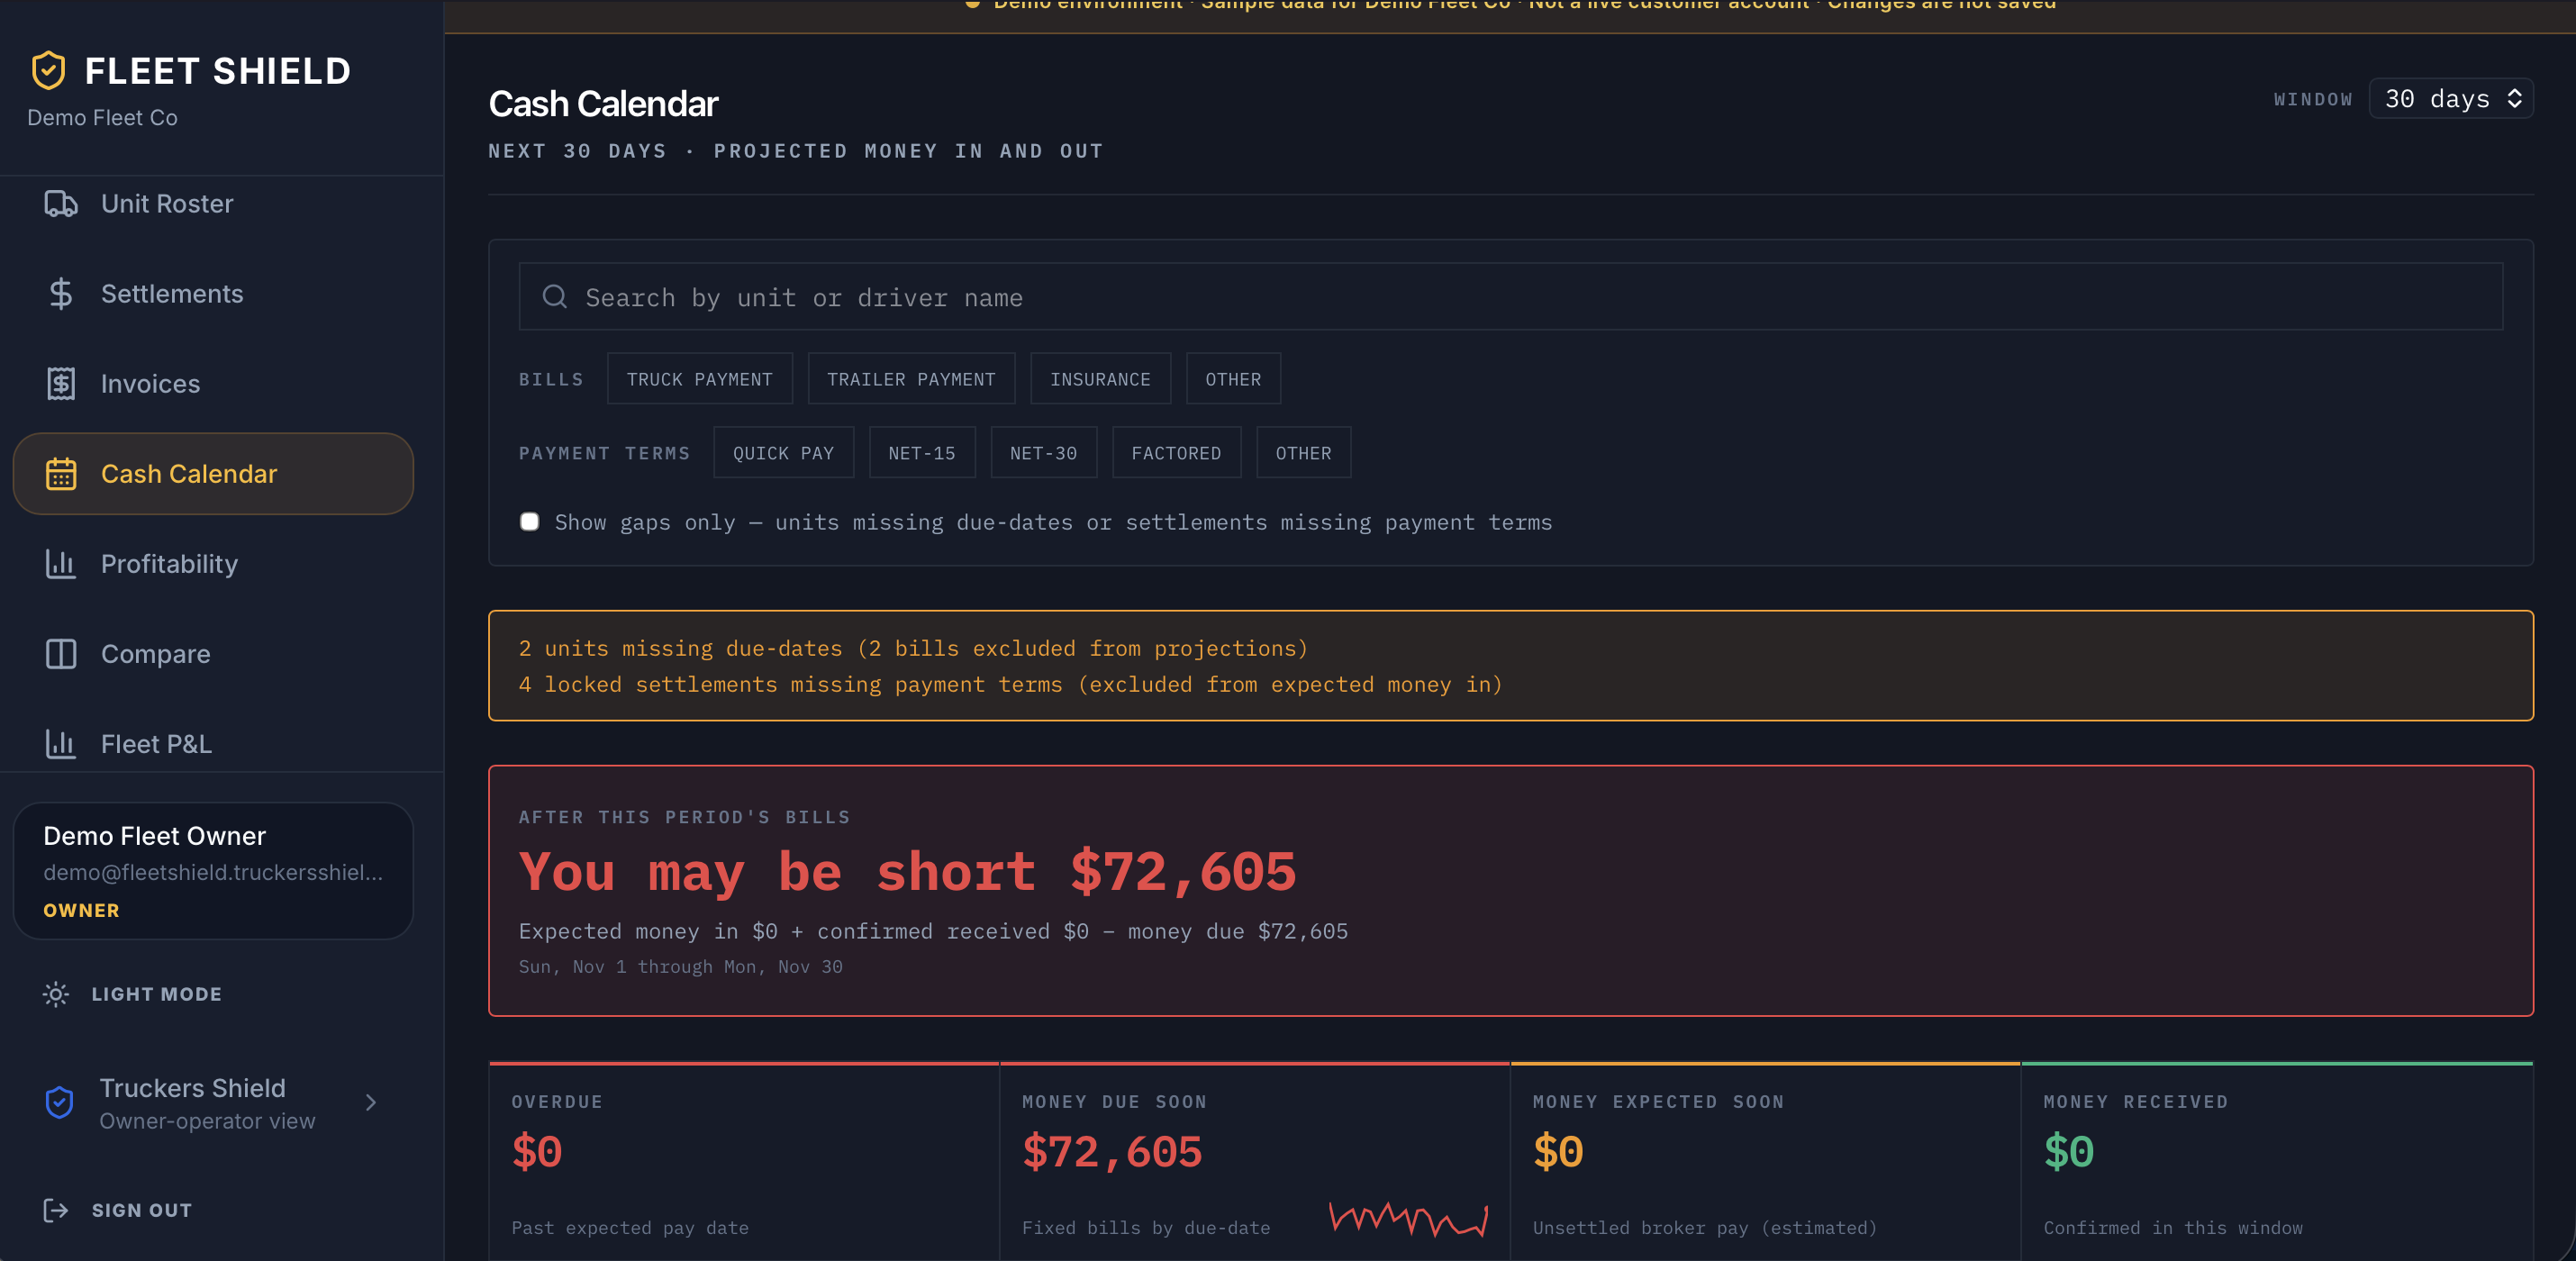
Project payables, expected settlements, and timing mismatches across a rolling window. Finance and operations can plan fuel, payroll, and carrier payments with visibility — not surprise.

Demo calendars may show severe gaps when sample receivables are empty. Production reflects your fleet’s actual AR/AP inputs.

Cash Calendar with thirty-day cash projection in Fleet Shield.

Weekly fleet financial reporting

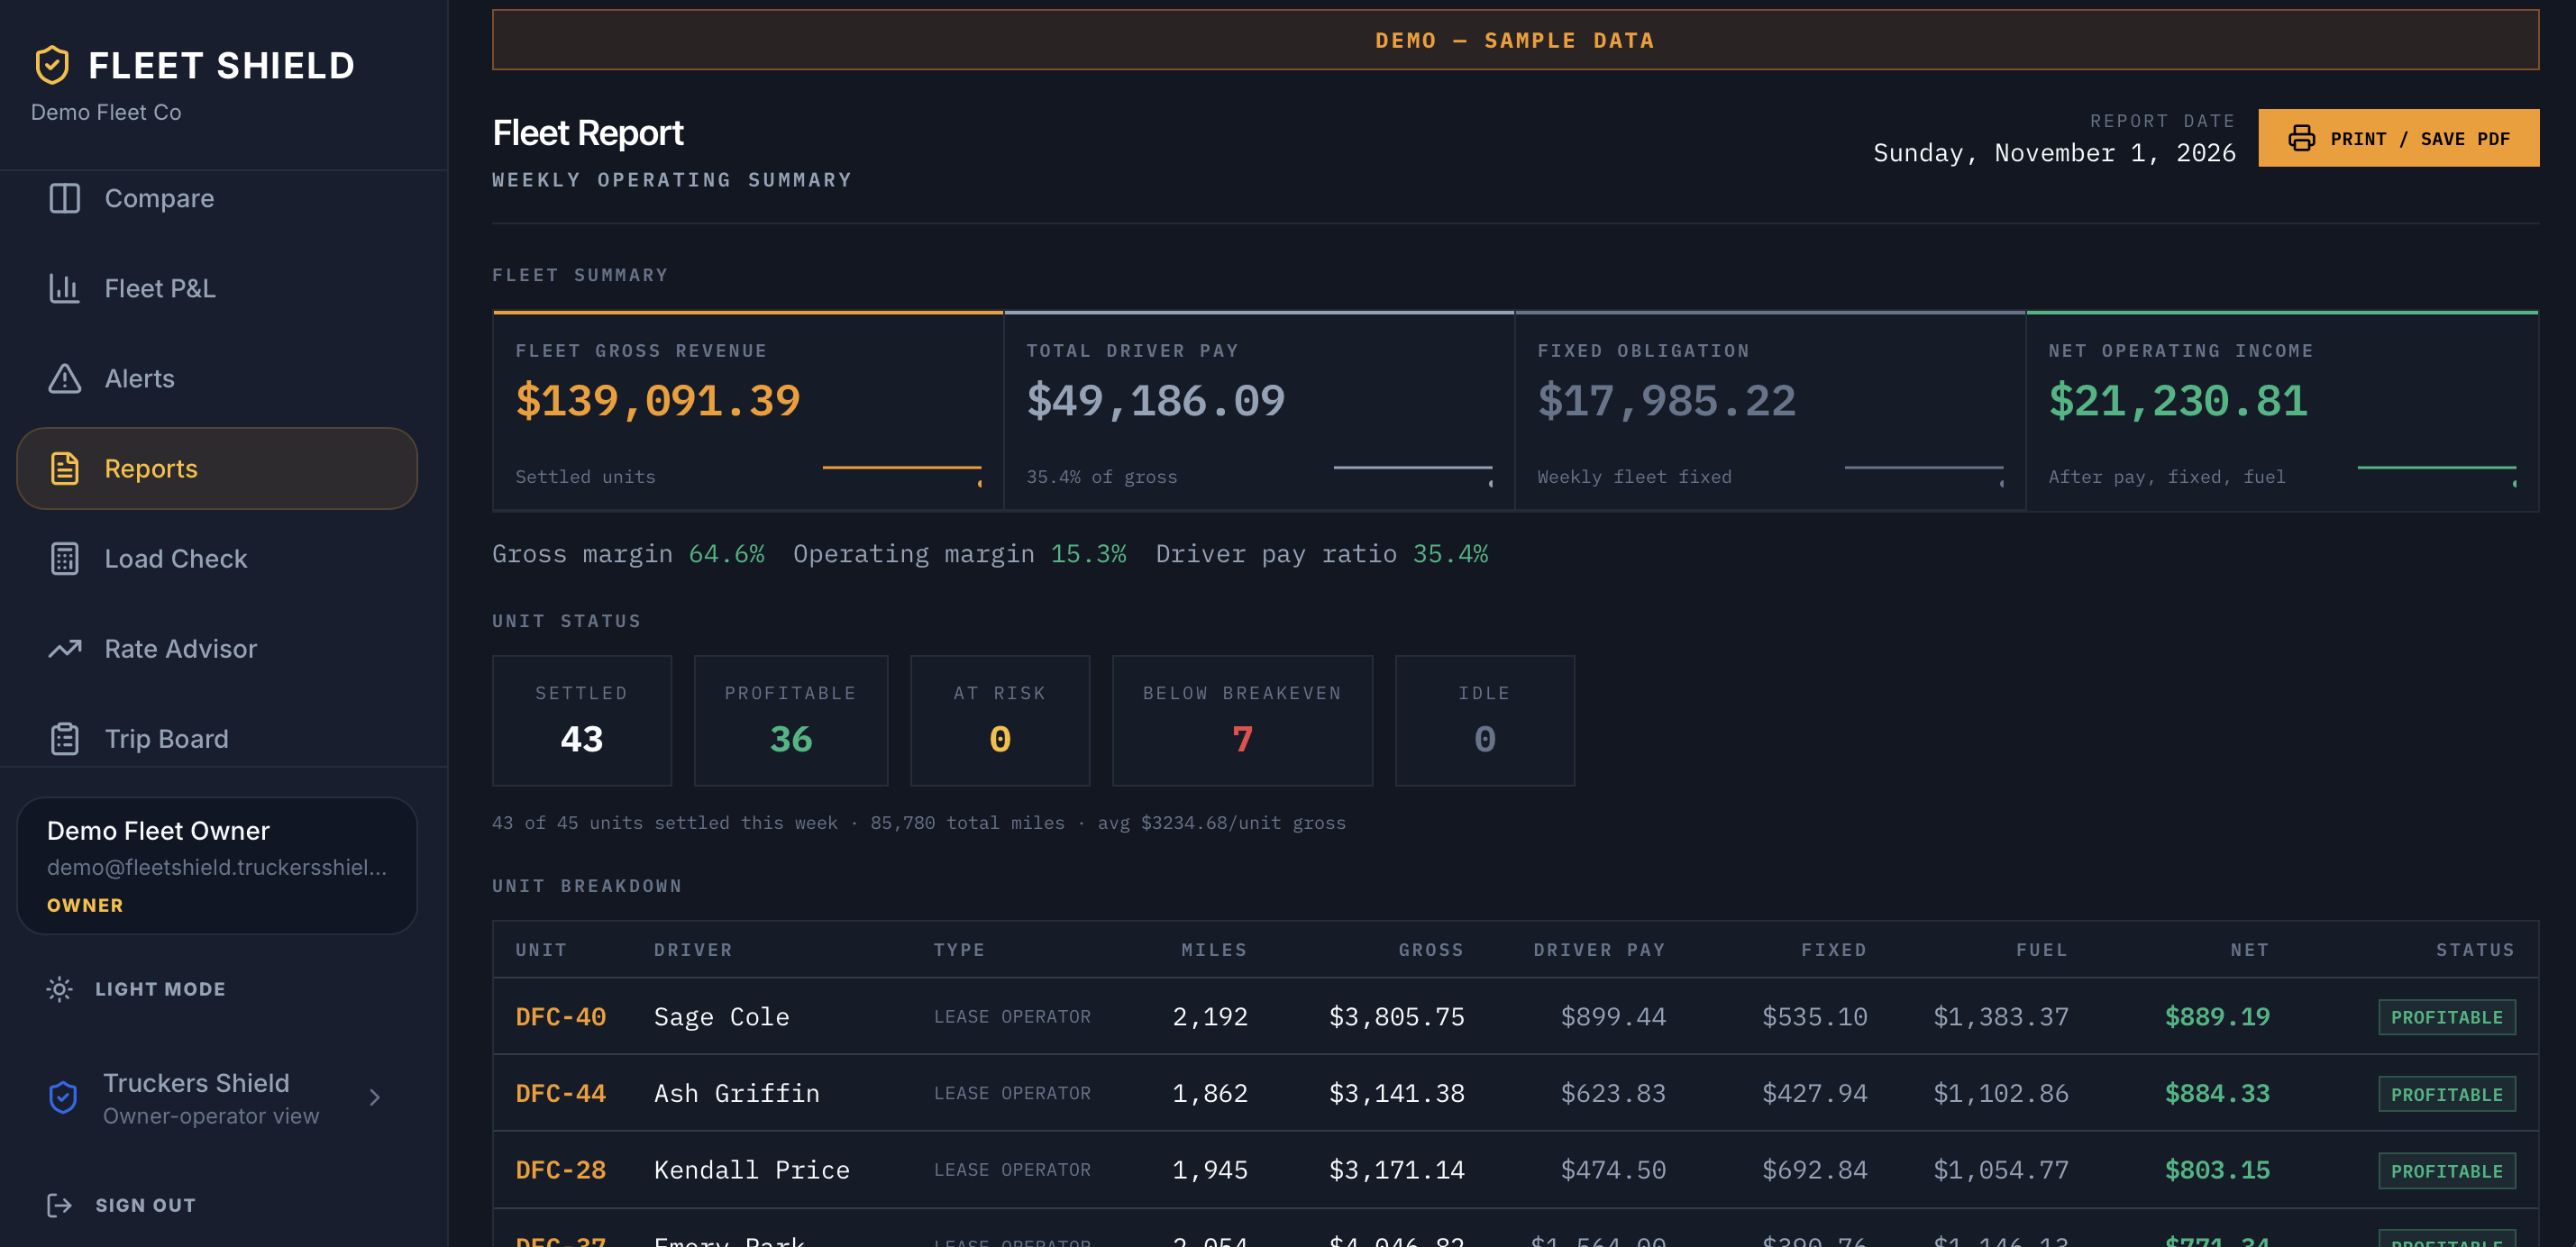
Consolidated operating summaries and unit tables leadership can review every week — without rebuilding spreadsheets or waiting for month-end close to learn which trucks dragged margin.

Weekly fleet financial report with summary and unit table.

The financial risks hiding inside your fleet

Published white papers and forensic fleet analysis show the same structural problem: consolidated P&L and spreadsheet averages hide which units subsidize which — while understated cost-per-mile models make every load look better than it is.

White Paper · Vol. 07

Hidden Portfolio Risk

What Fleet Owners Don't See Coming

Portfolio-level risk across every truck you operate — units that quietly lose money while fleet-wide averages still look acceptable. Per-unit visibility is the antidote.

Fleet research · PDF primary source
White Paper · Vol. 08

The $1.75M Blind Spot

What Fleets Lose When They Can't See Every Truck

Forensic financial analysis of cost blindness: when only 11 estimated inputs drive dispatch decisions, true breakeven CPM can sit a full dollar per mile above the model — with millions in unaccounted cost compounding monthly.

Modeled case study · not a public named client
  • $1.54M–$1.75M/month estimated unaccounted cost when 25-input reality is applied vs. an 11-line spreadsheet model (Vol. 8 executive summary).
  • $2.22/mile stated vs. $3.10–$3.22/mile reconstructed breakeven — an $0.88–$1.00/mile gap before profit (Vol. 8).
  • Profitable units subsidize losing units every week; “the fleet average is the most dangerous number in trucking” (Vol. 8).
  • Scenario: top performers can mask a large bottom tier — e.g. middle-case narrative where top 40 units subsidize bottom 45, with nearly a third of the fleet losing money every mile (Vol. 8 — illustrative scenario, not a universal statistic).

Fleet marketing benchmarks — verification status

15–20%

Units underperforming or at a loss in structured fleet reviews — cited on production Fleet Shield marketing; align with Vol. 7 portfolio-risk theme.

Founder review Vol. 7 PDF is image-based (text not machine-verifiable in repo). Vol. 8 scenario cites ~26% bottom tier (45 of 175) — different framing.

$100K–$500K

Annual exposure mid-size fleets may not see without truck-by-truck visibility — production homepage benchmark.

Founder review Exact range not found in Vol. 8 extractable text. Vol. 8 documents $465,960/yr at 1% monthly recovery and $2.33M/yr at 5% recovery for its modeled large-fleet case — scale varies by fleet.

$1.75M

Title figure from Vol. 8 — monthly unaccounted cost band ($1.54M–$1.75M/mo), not annual mid-fleet loss for every operator.

Verified in PDF text · Vol. 8 PDF · 150–175 unit I-5 corridor modeled analysis

Running Blind (Vol. 4)

Cost-per-mile blindness, settlement leakage, and why operators dispatch without knowing true breakeven — foundation for Rate Advisor and load economics.

Vol. 8 combines forensic analysis with industry-standard assumptions; it describes a 150–175 unit I-5 operating profile as a modeled case study, not a verified public customer case study. Figures are illustrative of cost-blindness patterns, not promises of recovery on your fleet. Vol. 4 and Vol. 7 PDFs are image-based in this repository — verify claims against human review of those documents.

Built by people who ran the trucks

Fleet Shield is developed by Goins Digital LLC — informed by more than 25 years of trucking, fleet ownership, freight brokerage, and logistics experience (2.5 million miles across every seat in the cab and the office).

The platform extends the Truckers Shield financial engine from owner-operators to multi-unit fleets — same discipline, fleet-wide scope.

See the real application — then talk about your fleet

Explore the live demo with sample data at your own pace, or contact us to discuss deployment for your fleet size and operational scope.

Custom quote · tailored deployment · View pricing tiers